Implementing Point-in-Polygon as a Custom Function in Power Query
9 February 2025 - Written by Markus Böhm
What is Point-in-Polygon?
Point-in-Polygon is a geometric function used in geospatial analysis to determine if a point is inside or outside a defined area. The area is represented by a polygon, a closed shape defined by a series of connected points.
The function takes a point and a polygon as inputs and returns whether the point is inside the polygon:
PointInPolygon(Point, Polygon)
A practical example might involve a dataset containing latitude and longitude coordinates for events like lightning strikes, train stops, or photo locations. By applying Point-in-Polygon, you can determine which city or country each event occurred in. This is a form of reverse geocoding, where the event’s coordinates are compared to the boundary of a geographic area (e.g., a city or country).
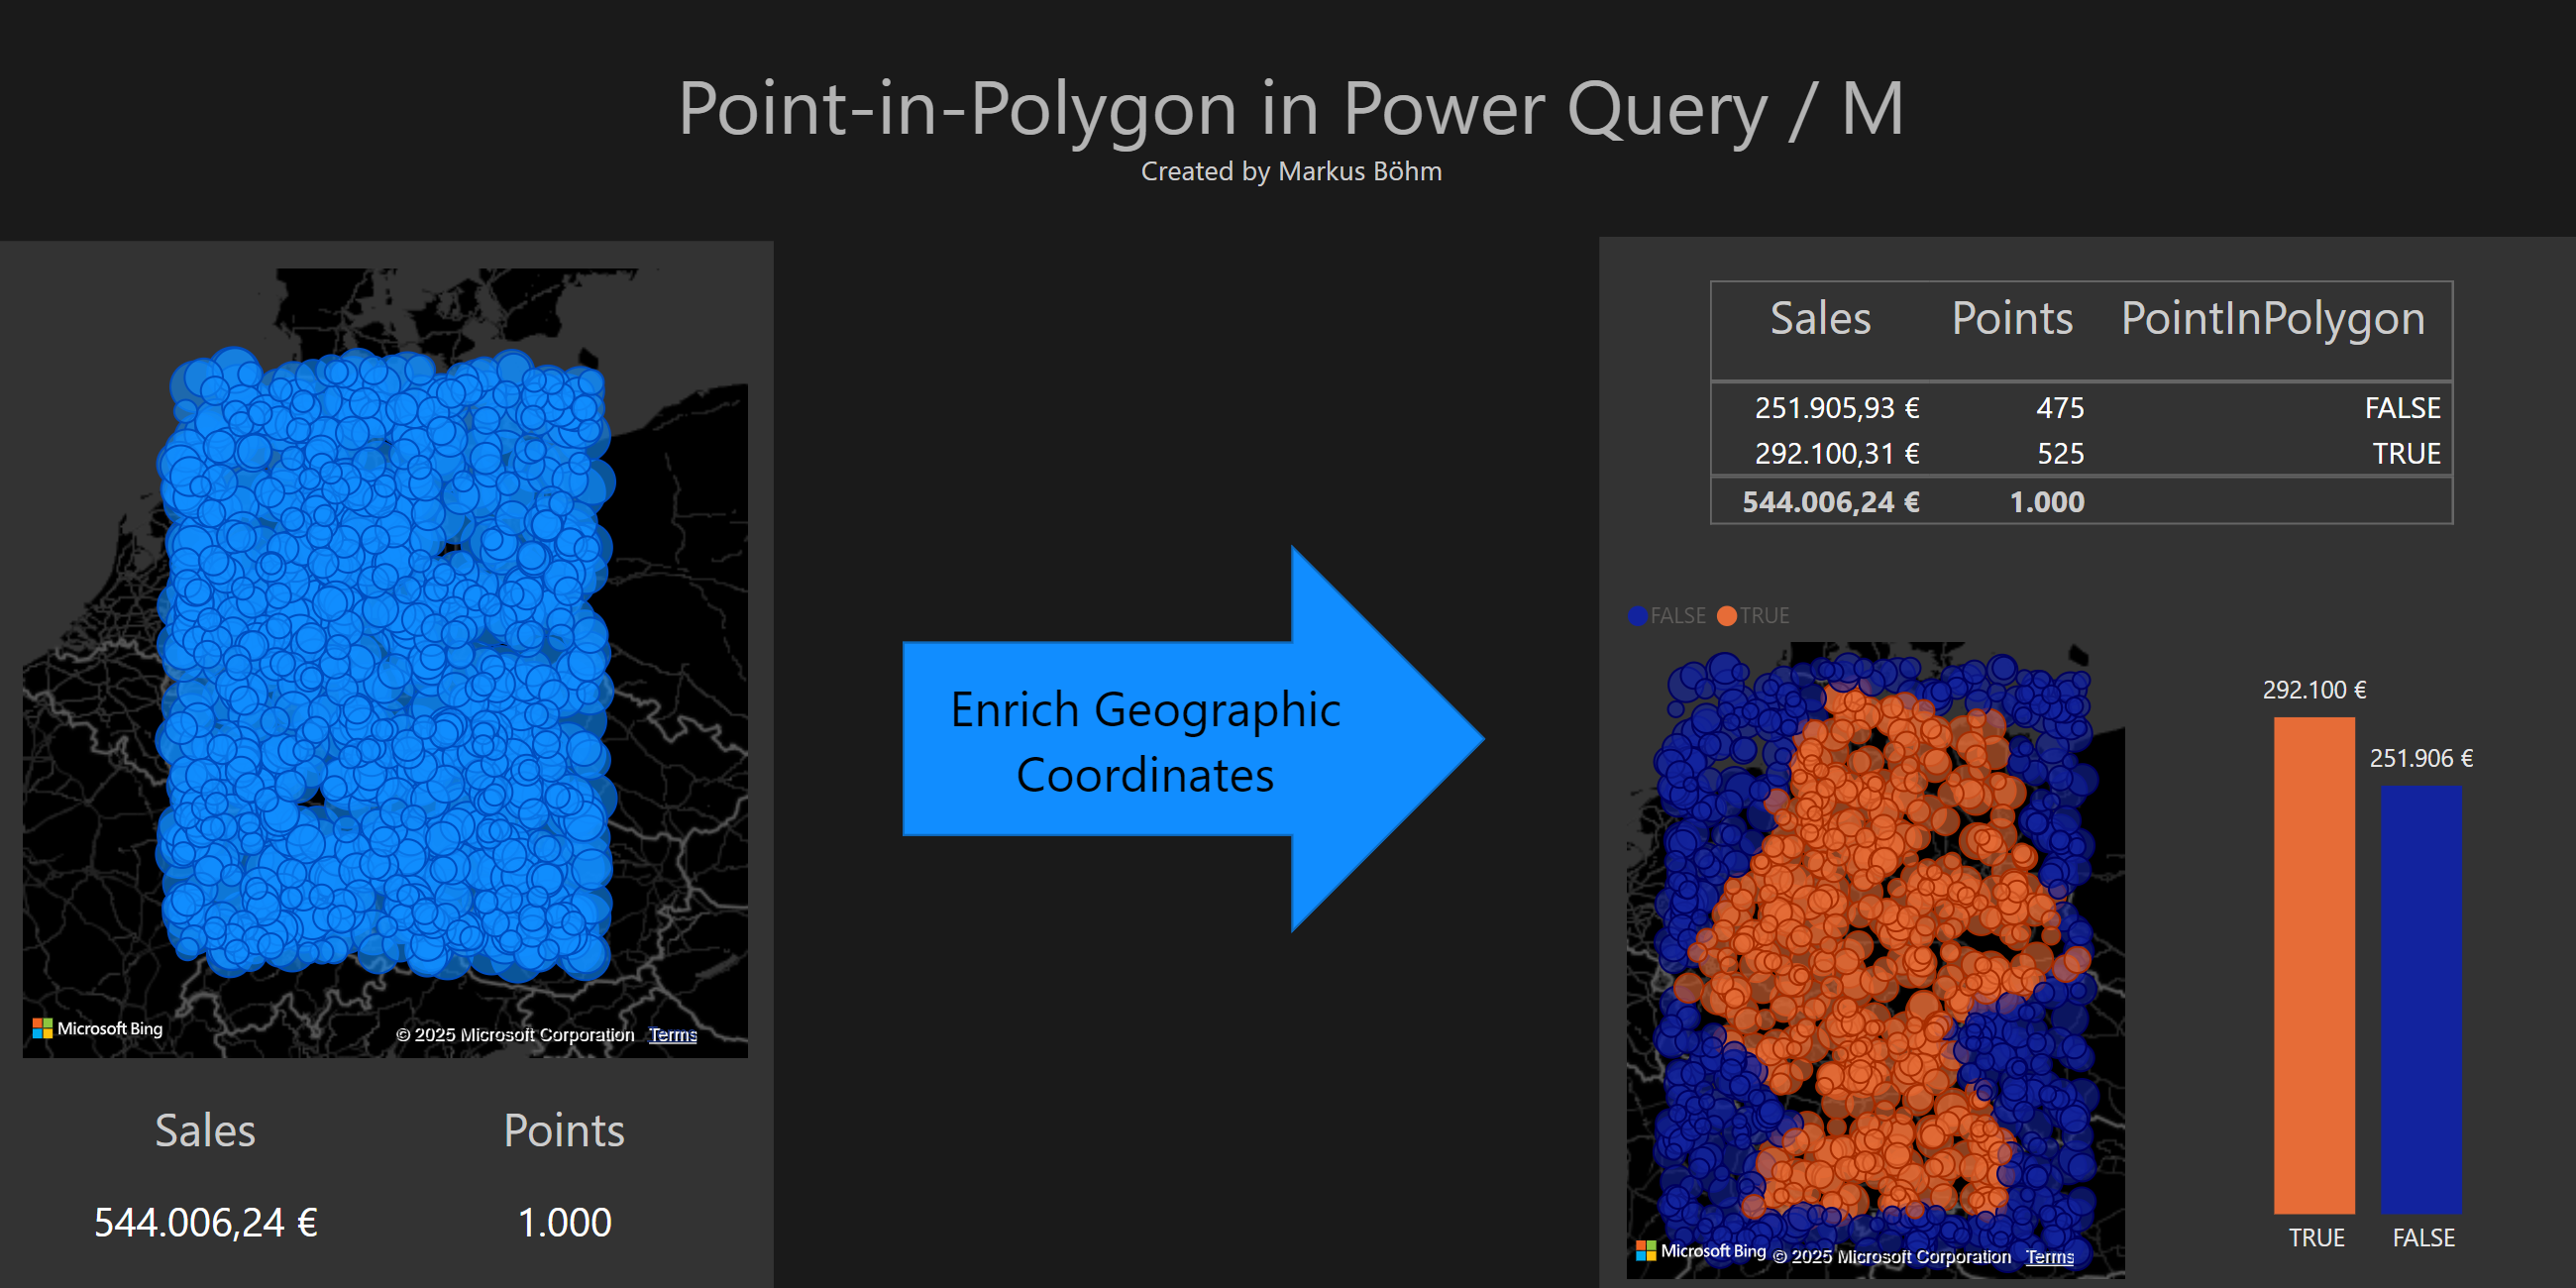
The function returns TRUE or FALSE based on whether the point is inside or outside the polygon. The image above illustrates how Point-in-Polygon works: on the left, individual points, while on the right, Point-in-Polygon has been applied, categorizing the points as either inside (TRUE) or outside (FALSE) the polygon. This category allows to analyze how many points fall inside the polygon and to color-code the points.
Point-in-Polygon in Power BI
Power BI has three layers to work with data:
- Power Query for transforming data
- DAX for modeling data
- Visuals for presenting data
These layers are stacked: DAX builds on Power Query, and Visuals build on DAX. Higher layers can use the results of lower layers, but not the other way round.
By implementing a solution in Power Query, you make it accessible across all layers—Power Query, DAX, and Visuals—while keeping the higher layers clean and maintainable. This approach eliminates the need for complex DAX code or specialized visuals.
Point-in-Polygon in Power Query with Well-Known Text
How should we represent the point and the polygon in Power Query?
Power Query offers data structures and functions for geographic data, including the ability to serialize the geographic data into text using Well-Known Text (WKT). WKT is a simple and intuitive way to represent geographic features, which makes it ideal for our Point-in-Polygon implementation.
In WKT format, a polygon is represented as a list of coordinates, in the form of longitude and latitude pairs. It starts with the keyword POLYGON. Here’s an example of a polygon in WKT:
POLYGON((9.57374 54.79966, 6.16667 50.77439, 8.77067 49.01764, 7.65096 47.61366, 13.15440 47.61719, 13.43284 48.56898, 11.94725 50.31306, 14.90610 51.14647, 13.18257 54.31174, 9.57374 54.79966))
Points are represented using the keyword POINT, followed by the longitude and the latitude.
POINT(13.23144 51.59336)
POINT(14.74258 53.44608)
WKT uses single brackets for POINT and double brackets for POLYGON. The double brackets allow for more complex shapes (e.g., areas with holes), but we’ll focus on ordinary polygons for simplicity.
Now that we understand the format, let’s dive into the implementation.
M function PointInPolygon
To define PointInPolygon in Power Query, create a Blank Query and paste the following code into the Advanced Editor. Name your function PointInPolygon.
= (WktPoint as text,WktPolygon as text) as logical=>
let
    Point = Geography.FromWellKnownText(WktPoint),
    Polylist = Geography.FromWellKnownText(WktPolygon)[Rings]{0}[Points],
    Edges = List.Zip({List.RemoveLastN(Polylist,1),List.RemoveFirstN(Polylist,1)}),
    Crossed = List.Select(Edges,each
        (_{0}[Latitude]>Point[Latitude] <> _{1}[Latitude]>Point[Latitude])
          and
        (Point[Longitude] <
            (_{0}[Longitude]-_{1}[Longitude]) * (Point[Latitude]-_{1}[Latitude]) / (_{0}[Latitude]-_{1}[Latitude])
            + _{1}[Longitude])
    ),
    Result = Number.IsOdd(List.Count(Crossed))
in
    Result
This function uses the ray-casting algorithm, which counts the number of intersections between a horizontal ray emitted from the point and the polygon’s edges. If the number of intersections is odd, the point is inside; if it’s even, the point is outside.
For more information on the geometry behind this algorithm, check out Geoanalysis with Power BI.
How the function works:
- Convert WKT: The point and polygon in WKT format are converted to structured data.
- Define Polygon Edges: The polygon’s edges are formed by connecting each point with its successor.
- Check for Intersections: Each edge is tested for intersection with the ray.
- Odd or Even?: If the number of intersections is odd, the point is inside the polygon; if even, it’s outside.
Testing PointInPolygon in Power Query
To test the function, click on the newly defined PointInPolygon function in Power Query. You’ll be prompted to enter values for the two parameters. Paste a WKT polygon and a WKT point, e.g. the examples from above, then click Invoke.
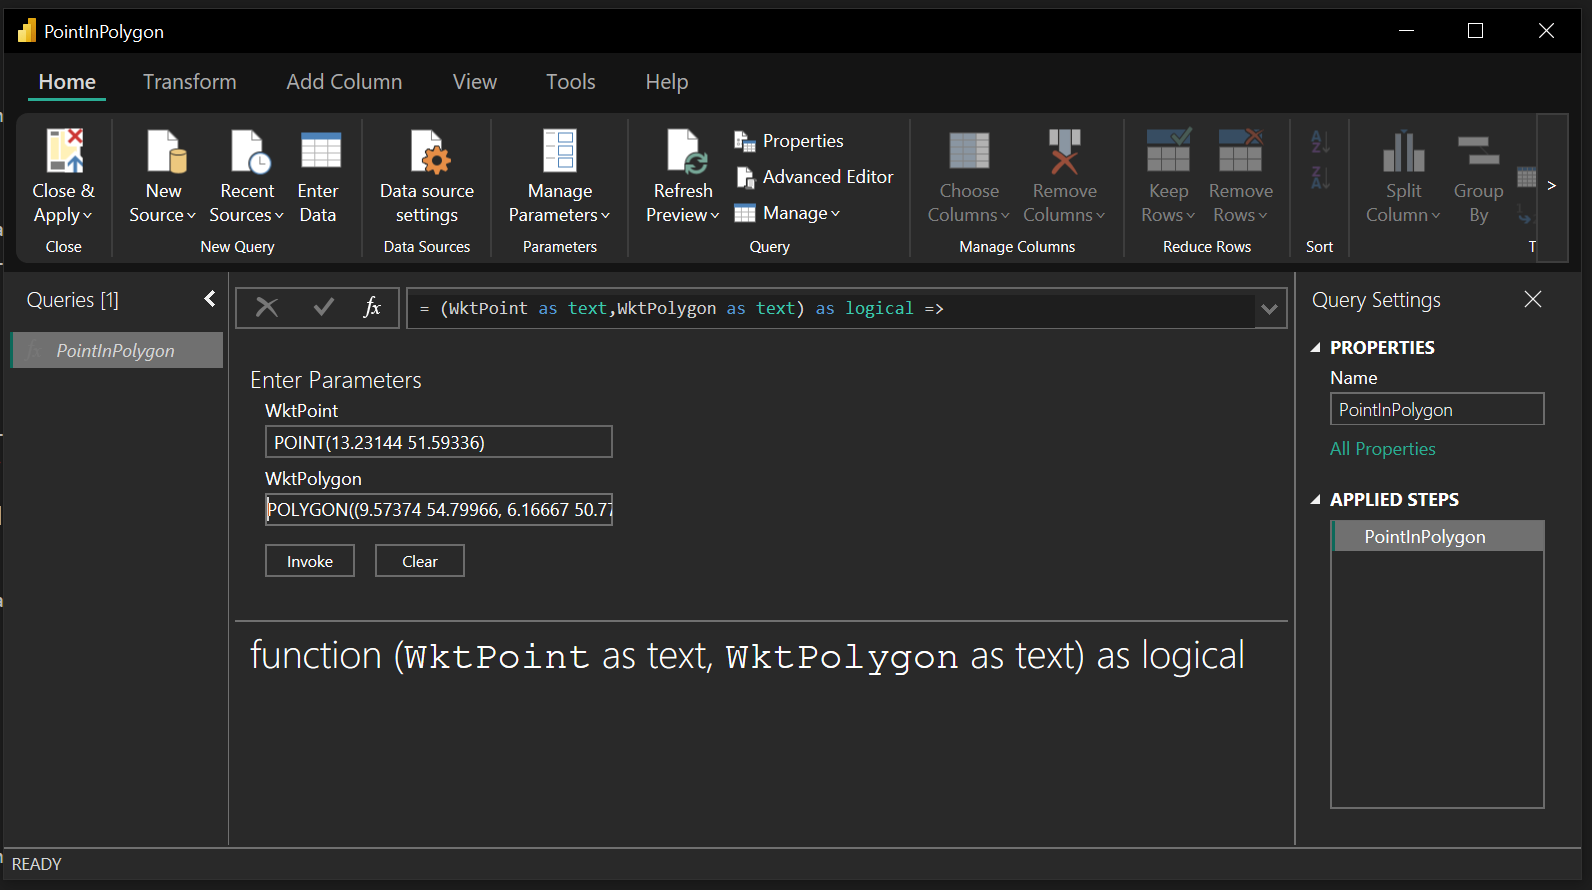
You should see that the function returns TRUE for a point inside the polygon, POINT(13.23144 51.59336), and FALSE for a point outside the polygon, POINT(14.74258 53.44608).
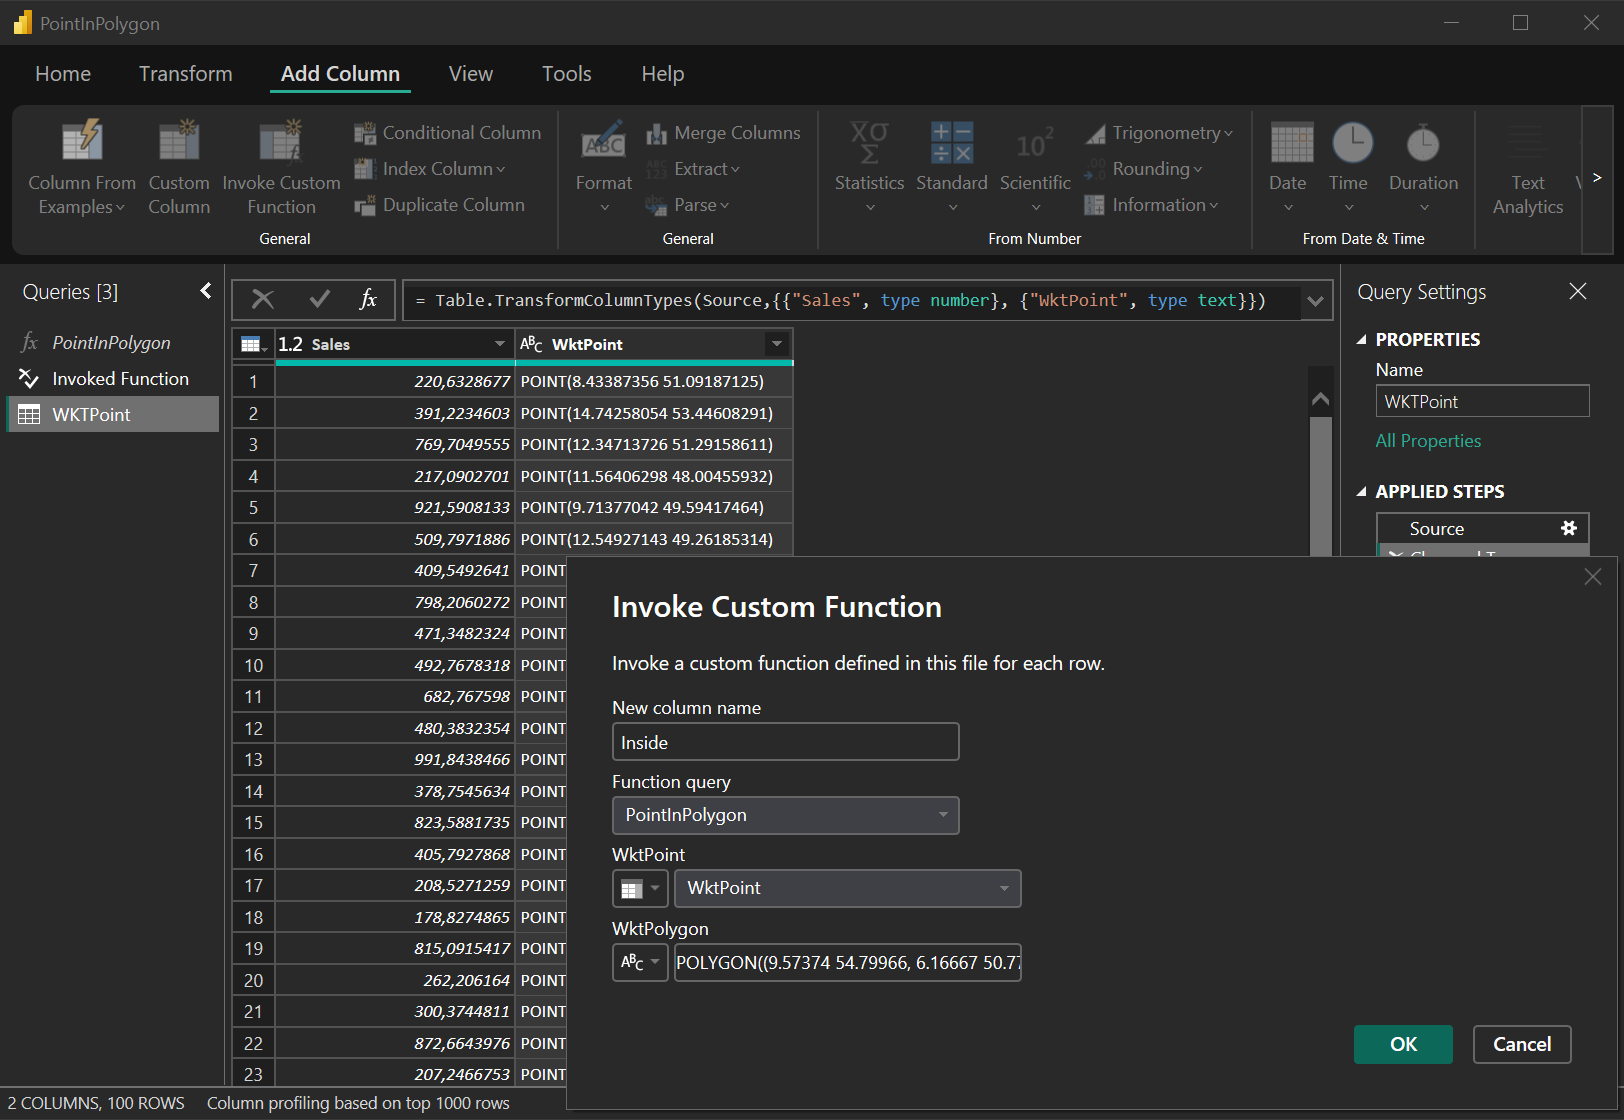
Using PointInPolygon with a Table of Points
To apply the function to a table of points, select the column containing the points and use Invoke Custom Function to apply PointInPolygon to each row. You can use the WKT polygon from above for the second parameter.
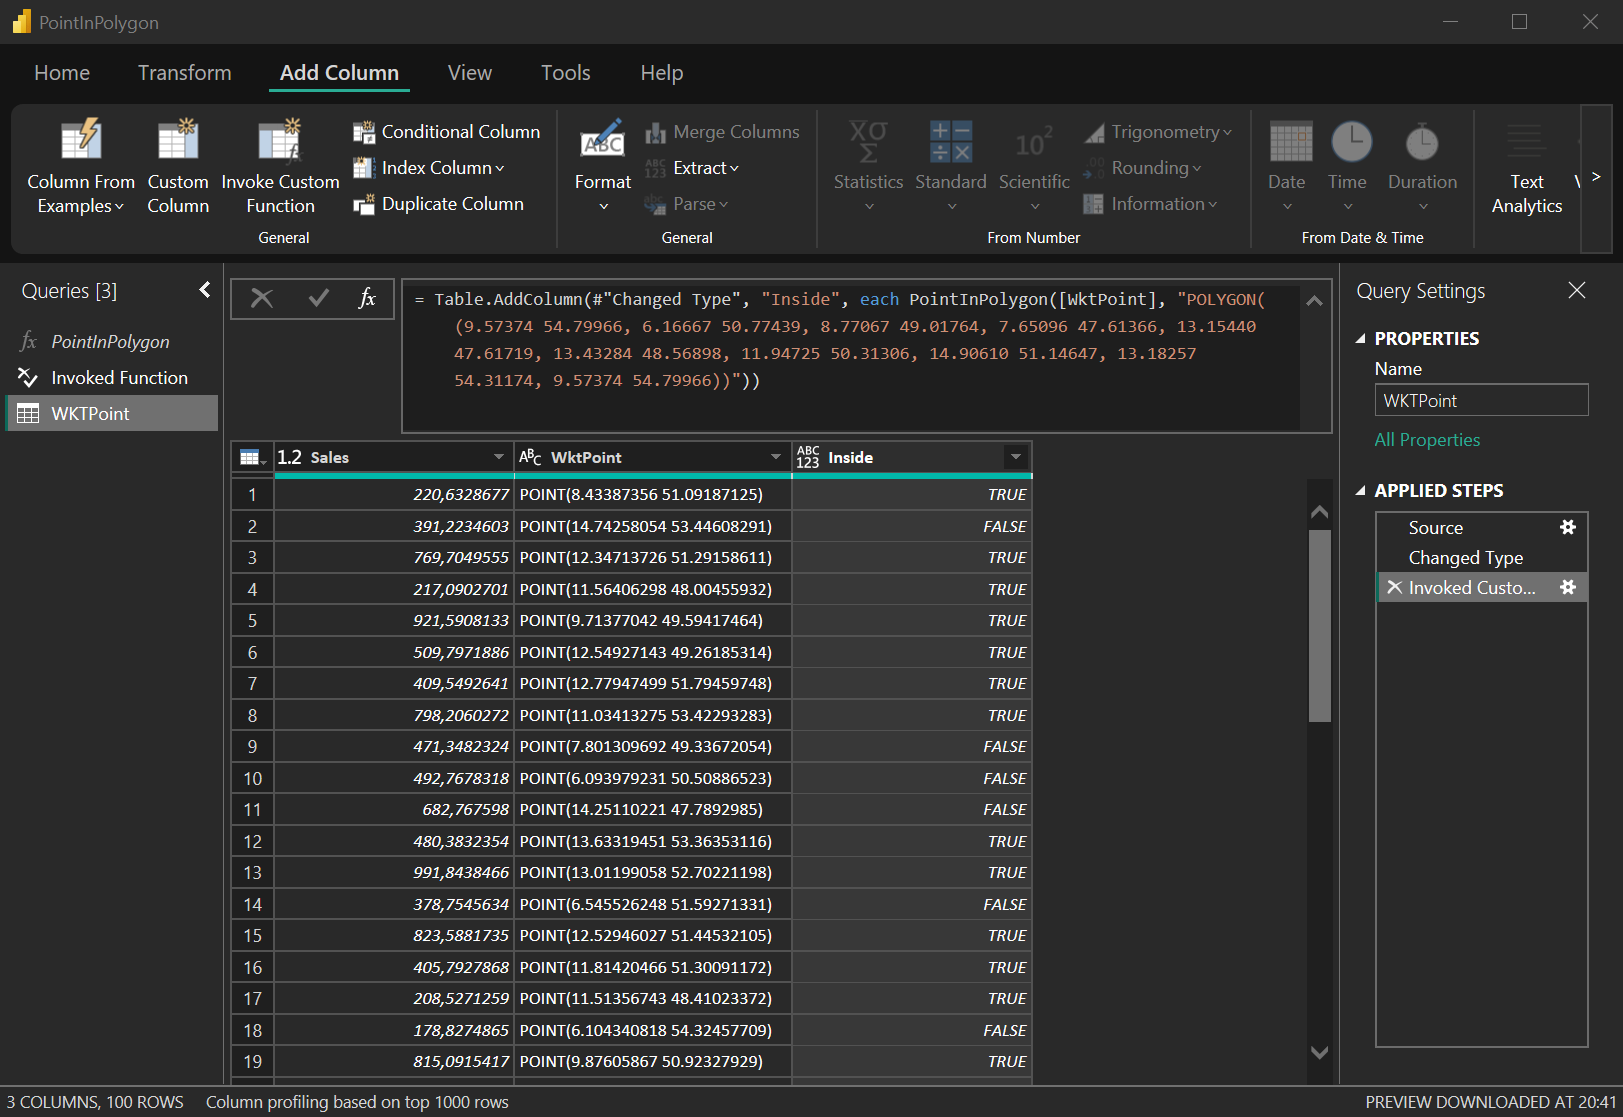
You get a new column classifying each point as either inside (TRUE) or outside (FALSE) the polygon:
Transforming Latitude and Longitude into WKT and vice versa
Once the data is classified, you can use the results in DAX for analysis and visualization. While most map visuals in Power BI require latitude and longitude, you can easily convert between these and WKT format in Power Query using Geography.FromWellKnownText.
To extract the longitude:
Geography.FromWellKnownText([WktPoint])[Longitude]
To extract the latitude:
Geography.FromWellKnownText([WktPoint])[Latitude]
To build WKT from longitude and latitude:
Geography.ToWellKnownText(GeographyPoint.From([lon],[lat]))
Alternatively, basic text transformations can also do the job.
PointInPolygon using Latitude and Longitude
If you prefer using latitude and longitude directly, here’s an alternative version of the function:
= (lat as number, lon as number ,WktPolygon as text) as logical =>
let
    Polylist = Geometry.FromWellKnownText(WktPolygon)[Rings]{0}[Points],
    Edges = List.Zip({List.RemoveLastN(Polylist,1),List.RemoveFirstN(Polylist,1)}),
    Crossed = List.Select(Edges,each
        (_{0}[Y]>lat <> _{1}[Y]>lat)
          and
        (lon < (_{0}[X]-_{1}[X]) * (lat-_{1}[Y]) / (_{0}[Y]-_{1}[Y]) + _{1}[X])
    ),
    Result = Number.IsOdd(List.Count(Crossed))
in
    Result
To shorten the code this function uses the M class Geometry instead of Geography.
Visualizing the Result
Once you’ve applied the PointInPolygon function, you can visualize the data in Power BI. For example, you can use different colors to represent points inside and outside the polygon on a map. You can also group or filter measures based on this new classification.
Here is an example of 1000 points, each having an additional Sales value. By using the above M-function the data is enriched with a new column named PointInPolygon. The resulting DAX table data starts like this:
| lon | lat | Sales | PointInPolygon |
|---|---|---|---|
| 492.77 | 6.09398 | 50.50887 | FALSE |
| 682.77 | 14.25110 | 47.78930 | FALSE |
| 480.38 | 13.63319 | 53.36353 | TRUE |
| 991.84 | 13.01199 | 52.70221 | TRUE |
| 378.75 | 6.54553 | 51.59271 | FALSE |
Below is screenshot of a Power BI page with several visuals based on this tabular data.
On the left of the page PointInPolygon is not used. The Map visual shows the points at their location. The measures Point and Sales display the total number of points and the sum of the Sales.
On the right hand side of the page we use the PointInPolygon data. The Map uses different colors for the points. If a point is inside it is orange otherwise blue. The measures are grouped by PointInPolygon and displayed in a table and a column chart. This provides a lot more insight.
This insight is made possible by the M-function PointInPolygon.
Conclusion
Power Query offers many powerful built-in functions, but custom functions like PointInPolygon significantly expand its capabilities. This function is reliable, performant, and reusable, making it an essential tool for geographic analysis in Power BI, Dataflows, and Excel.
If you’re interested in exploring more on the geometry of Point-in-Polygon or its applications in DAX, check out Geoanalysis with Power BI.
Enjoyed this post?
I’d like to hear about your use cases for Point-in-Polygon in Power Query. Feel free to comment on LinkedIn or X.
If there is enough interest, I may create more detailed posts on this topic!