Implementing Point-in-Polygon in DAX
2 December 2024 - Written by Markus Böhm
What is Point-in-Polygon?
Point-in-Polygon is a geometric function used in geospatial analysis to determine if a point is inside or outside a defined area. The area is represented by a polygon, which is a series of points forming the boundary.
The function works as follows:
Point-in-Polygon(Polygon, Point)
For example, you might have latitude and longitude data from events like lightning strikes, train stops, or photos taken. To identify which country or city each event occurred in, you would use Point-in-Polygon. This task, known as reverse geocoding, requires the definition of a geographic area (such as a country or city) as a polygon and the event’s coordinates. The function returns inside or outside based on whether the point is within the polygon.
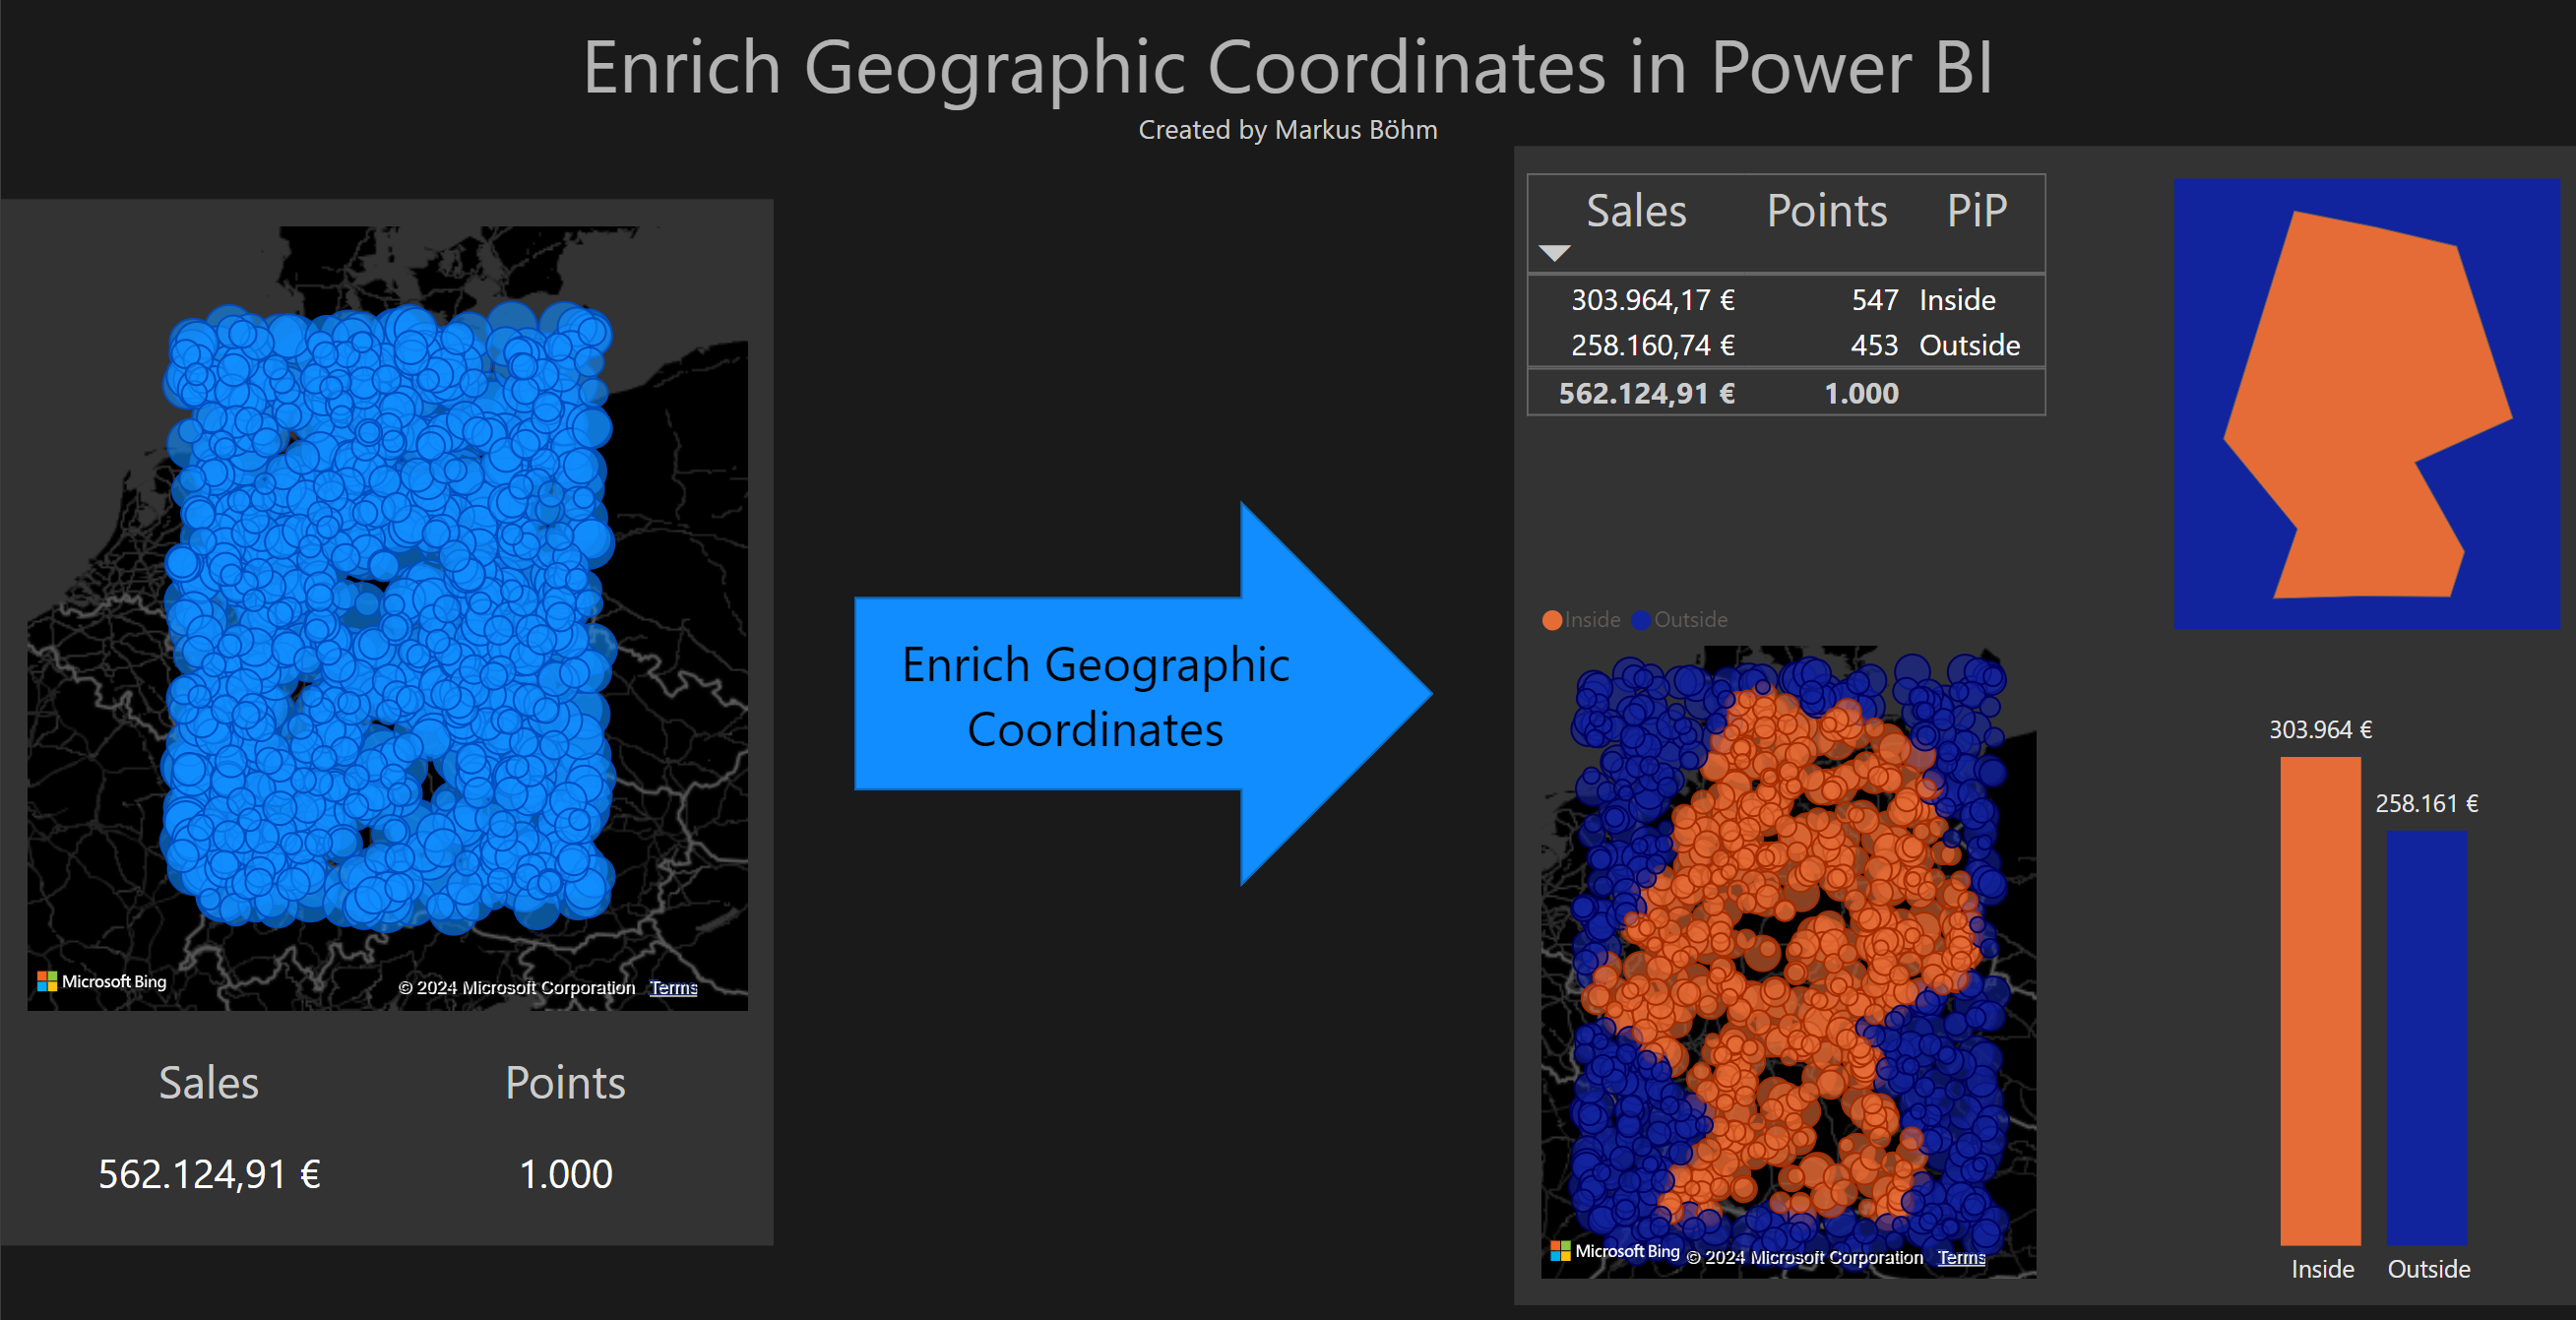
The image below illustrates the use of Point-in-Polygon. On the left, you see individual points with no structure, and on the right, Point-in-Polygon is applied, enriching the points with their respective areas. This allows for analysis of how many points fall inside the polygon and color-coding based on this relationship.
Two Approaches to Implement Point-in-Polygon in DAX
There are two approaches to implementing Point-in-Polygon in DAX:
- Use existing code from other programming languages and translate it to DAX.
- Invest the time to understand the underlying algorithm and implement it in DAX.
The fastest approach would be to find existing code for DAX.
A year ago, when searching for a Point-in-Polygon solution in Power BI, I found examples using external tools like Python within Power Query. However, I didn’t come across any solutions that were fully contained within Power BI itself, so I decided to create my own solution. My journey began with understanding the algorithm and how it works before implementing it in DAX. For a deeper dive into this approach, check out my post Geoanalysis with Power BI.
Here we take the first approach: Translating existing code.
Shortcut to Point-in-Polygon in DAX
This post does not dive into the algorithm but focuses on quickly translating existing code into DAX. This isn’t the approach I initially used, but I find it interesting to explore whether it could have been a time-saving shortcut for me.
By translating code directly, we can bypass the time required to understand the algorithm’s underlying geometry concepts. We only need to grasp the code itself, not the mathematical principles behind it.
DAX differs from traditional programming languages in several key areas. Therefore, the first step is to identify which parts of the existing code and its data structures can be reused in DAX and which need to be reimagined.
In the end, we will have working DAX code and a reflection on what we learned from this approach.
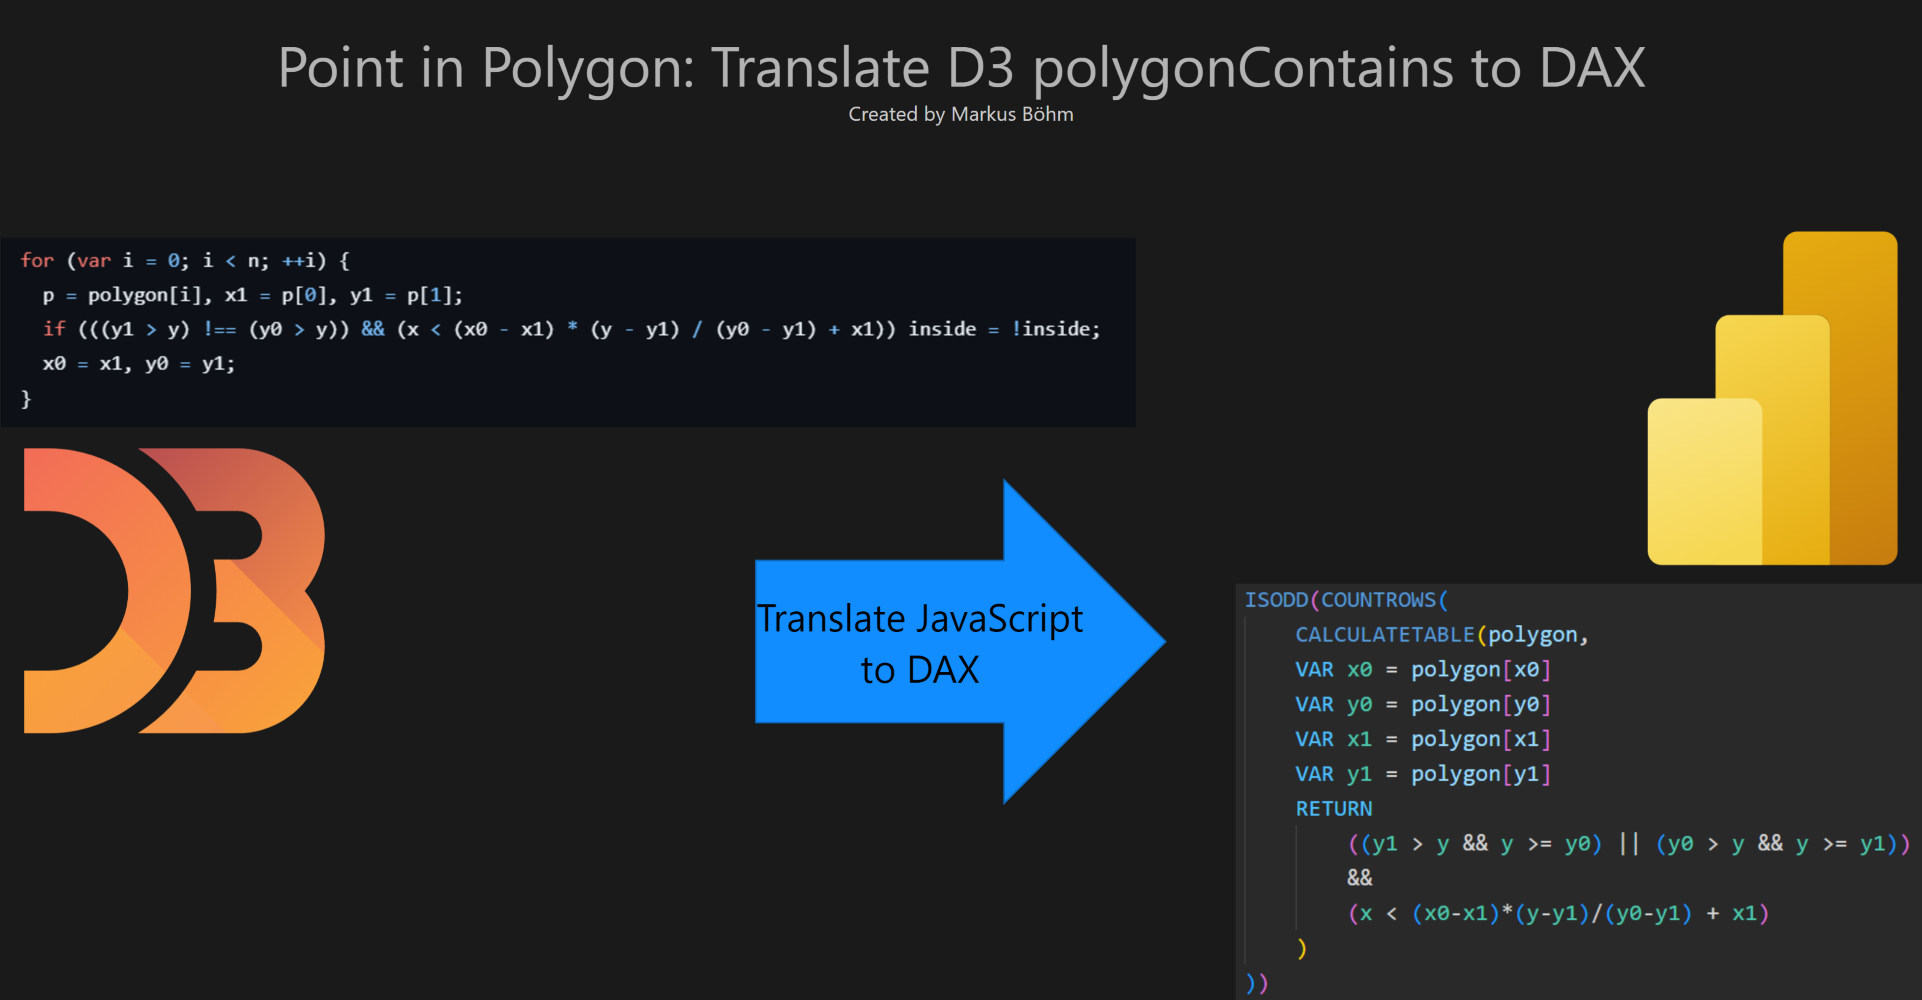
Point-in-Polygon in JavaScript / D3
An elegant implementation of Point-in-Polygon ca be found in the widely used library D31. Its module D3-polygon includes the function polygonContains:
export default function(polygon, point) {
  var n = polygon.length,
      p = polygon[n - 1],
      x = point[0], y = point[1],
      x0 = p[0], y0 = p[1],
      x1, y1,
      inside = false;

  for (var i = 0; i < n; ++i) {
    p = polygon[i], x1 = p[0], y1 = p[1];
    if (((y1 > y) !== (y0 > y)) && (x < (x0 - x1) * (y - y1) / (y0 - y1) + x1)) inside = !inside;
    x0 = x1, y0 = y1;
  }

  return inside;
}
This D3 function takes a polygon and a point as inputs. In D3 the polygon is represented as an array of arrays: An array of points with each point being an array of two numbers. And the point is an array of two numbers.
The function returns true if the point lies inside the polygon.
The JavaScript implementation uses a for-loop to iterate over all n points of the polygon.
With each iteration it uses the coordinates of the current point x1, y1 and the previous point x0, y0 to check a condition.
Each time the condition is true it flips the boolean variable inside, which, at the end, is returned.
The code is clean and efficient, and its structure is easy to understand even if you’re not familiar with JavaScript.
What Parts of the Code can we Use in DAX?
One key part of the code is the condition:
(((y1 > y) !== (y0 > y)) && (x < (x0 - x1) * (y - y1) / (y0 - y1) + x1))
DAX supports all the operators used in this condition, except for the XOR !==.
Replacing this XOR with AND and OR we get an equivalent condition which is usable in DAX:
(
    ( ((y1 > y) && (y0 <= y)) || ((y1 <= y) && (y0 > y)) )
    &&
    (x < (x0 - x1) * (y - y1) / (y0 - y1) + x1)
)
What Parts of the Code have to be Changed or Reinvented in DAX?
DAX lacks certain features present in other programming languages, such as loops, arrays, and a direct concept of the “previous” point.
A key consideration is that DAX does not have a data structure that guarantees order.
So, there are two main challenges we need to address:
- How do we loop in DAX?
- How do we represent polygons in DAX?
Let’s begin with looping.
Looping in DAX
The JavaScript, the code uses a for loop to iterate over all points in the polygon.
for (var i = 0; i < n; ++i) {
  p = polygon[i], x1 = p[0], y1 = p[1];
  if (((y1 > y) !== (y0 > y)) && (x < (x0 - x1) * (y - y1) / (y0 - y1) + x1)) inside = !inside;
  x0 = x1, y0 = y1;
}
In DAX, instead of using a traditional loop, we can work with tables to iterate through rows.
Here’s how:
- Create a table with as many rows as needed to represent the points in the polygon.
- Apply the condition to each row of the table.
- Count how many rows satisfy the condition. If the count is odd, the point is inside; otherwise, it’s outside.
Before writing the looping logic in DAX, we need to establish how to represent polygons effectively. Once that’s clear, we can return to the looping process.
Representing Polygons in DAX
DAX doesn’t have arrays, so what data structure can represent a polygon?
Let’s take an example with a simple polygon consisting of nine points. We’ll explore how to represent this and implement the necessary steps for Point-in-Polygon in DAX.
| lon | lat |
|---|---|
| 9.57374 | 54.79966 |
| 6.16667 | 50.77439 |
| 8.77067 | 49.01764 |
| 7.65096 | 47.61366 |
| 13.15440 | 47.61719 |
| 13.43284 | 48.56898 |
| 11.94725 | 50.31306 |
| 14.90610 | 51.14647 |
| 13.18257 | 54.31174 |
On a map the example polygon looks like this.
How can we represent this polygon in DAX?
In this section, we will explore different ways to represent polygons in DAX. We’ll focus on three data structures: Well-Known Text (WKT), an indexed table, and the edges of the polygon.
Polygon as WKT (Well-Known-Text)
A method for representing polygons in Power BI is Well-Known Text (WKT), which is a format for representing geometric shapes as text. WKT is commonly used in databases like SQL Server and can serialize complex geometric data into a simple text format, which can be easily transported.
In Power Query, WKT can be created from a list of points using the Geography.ToWellKnownText function, and the points can be extracted from WKT with Geography.FromWellKnownText. So, using WKT in Power BI is a practical approach. Some Power BI visualizations, such as Icon Map, can consume WKT and display the corresponding polygon on a map.
Here is an example of a polygon represented in WKT format:
POLYGON ((9.57374 54.79966, 6.16667 50.77439, 8.77067 49.01764, 7.65096 47.61366, 13.15440 47.61719, 13.43284 48.56898, 11.94725 50.31306, 14.90610 51.14647, 13.18257 54.31174, 9.57374 54.79966))
Polygon as an Indexed Table
DAX doesn’t support arrays, but it does support tables. However, a basic table that stores polygon points is not suitable because DAX tables do not guarantee an order of rows. To solve this, we add an index column to ensure the points are ordered correctly:
| idx | lon | lat |
|---|---|---|
| 1 | 9.57374 | 54.79966 |
| 2 | 6.16667 | 50.77439 |
| 3 | 8.77067 | 49.01764 |
| 4 | 7.65096 | 47.61366 |
| 5 | 13.15440 | 47.61719 |
| 6 | 13.43284 | 48.56898 |
| 7 | 11.94725 | 50.31306 |
| 8 | 14.90610 | 51.14647 |
| 9 | 13.18257 | 54.31174 |
By sorting the table by the index, we ensure that the points are in the correct sequence, which is essential for defining the polygon.
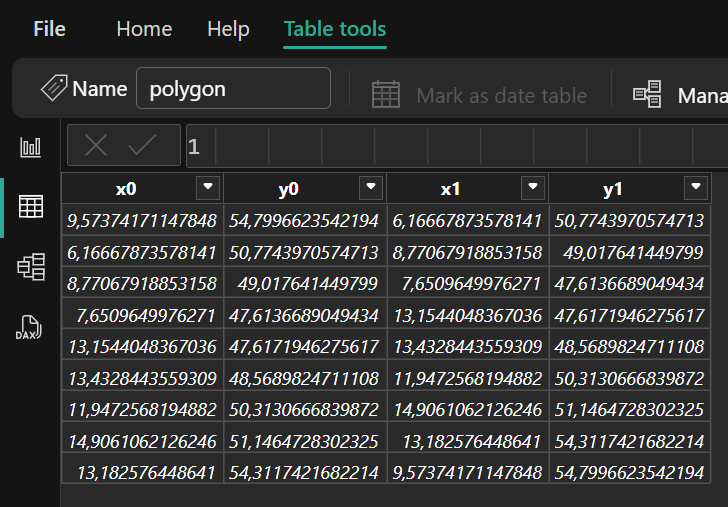
Polygon as Edges
Another effective way to represent a polygon in DAX is through its edges. Each polygon is defined by a series of connected points, and these connections form the polygon’s edges. Representing the polygon as edges provides a straightforward way to store the relationships between consecutive points.
Here is the polygon represented as a table of edges:
| A.lon | A.lat | B.lon | B.lat |
|---|---|---|---|
| 9.57374 | 54.79966 | 6.16667 | 50.77439 |
| 6.16667 | 50.77439 | 8.77067 | 49.01764 |
| 8.77067 | 49.01764 | 7.65096 | 47.61366 |
| 7.65096 | 47.61366 | 13.15440 | 47.61719 |
| 13.15440 | 47.61719 | 13.43284 | 48.56898 |
| 13.43284 | 48.56898 | 11.94725 | 50.31306 |
| 11.94725 | 50.31306 | 14.90610 | 51.14647 |
| 14.90610 | 51.14647 | 13.18257 | 54.31174 |
| 13.18257 | 54.31174 | 9.57374 | 54.79966 |
Each row represents an edge between two consecutive points. The beauty of this representation is that the necessary connections between the points are already stored, so we don’t need to manually link them.
Comparison of WKT, Indexed Table and Edges
Each of the representations can be used to create a Point-in-Polygon solution in DAX.
There are minor differences in memory consumption — edges need more memory — and the maximum number of points in a polygon — WKT is restricted to 32KB. When dealing with a small number of polygons and a limited number of points per polygon, these differences will not be a concern.
But there are big differences in the final DAX code. This will depend strongly on the representation.
Looping over WKT, Indexed Table and Edges
We need a table to loop in DAX:
- Indexed table and edges are tables. They are ready to loop.
- WKT requires parsing to create a table.
In each iteration we need access to the current point and the previous point:
- In the edges representation this data is available in the current row.
- In the indexed table the current point is available but the previous point has to be retrieved by complex and potentially slow code.
In summary, edges are the simplest and most efficient representation for Point-in-Polygon in DAX.
Point-in-Polygon in DAX
Now that we have chosen to represent the polygon as edges, we can start to write the DAX code for Point-in-Polygon. Let’s revisit the elegant D3 code:
export default function(polygon, point) {
  var n = polygon.length,
      p = polygon[n - 1],
      x = point[0], y = point[1],
      x0 = p[0], y0 = p[1],
      x1, y1,
      inside = false;

  for (var i = 0; i < n; ++i) {
    p = polygon[i], x1 = p[0], y1 = p[1];
    if (((y1 > y) !== (y0 > y)) && (x < (x0 - x1) * (y - y1) / (y0 - y1) + x1)) inside = !inside;
    x0 = x1, y0 = y1;
  }

  return inside;
}
Our input is a point in the table Points and a polygon in the table polygon. The polygon is represented as edges.
This is the translated DAX code:
PointInPolygon =
VAR y = Points[lat]
VAR x = Points[lon]
VAR Inside =
    ISODD(COUNTROWS(
        CALCULATETABLE(polygon,
            VAR x0 = polygon[x0]
            VAR y0 = polygon[y0]
            VAR x1 = polygon[x1]
            VAR y1 = polygon[y1]
            RETURN
                ((y1 > y && y >= y0) || (y0 > y && y >= y1))
                &&
                (x < (x0-x1)*(y-y1)/(y0-y1) + x1)
        )
    ))
RETURN IF(Inside,"Inside","Outside")
This code iterates over the rows in the edges table polygon, checks the condition for each pair of consecutive points, and counts how many times the condition is met. If the count is odd, the point is inside the polygon.
The iteration is done with CALCULATETABLE and the counting with COUNTROWS.
The IF converts the truth value into a text.
What did we change while translating the JavaScript code to DAX?
The final code in DAX is nearly as short and elegant as the JavaScript code. This was possible by representing the polygon as a specially prepared table of edges.
What else did we change:
- The condition uses the operators AND
&&and OR||to replace the original XOR!==. - Instead of a
for-loop we useCALCULATETABLEto iterate. - We count and check the count for being odd instead of multiple flipping a variable.
Now we put it all together and test it with our example polygon in Power BI.
Geospatial analysis using Point-in-Polygon in DAX
Table with events and their latitude and longitude
Let’s assume that we have geographic data on some events. We store them in a table Points.
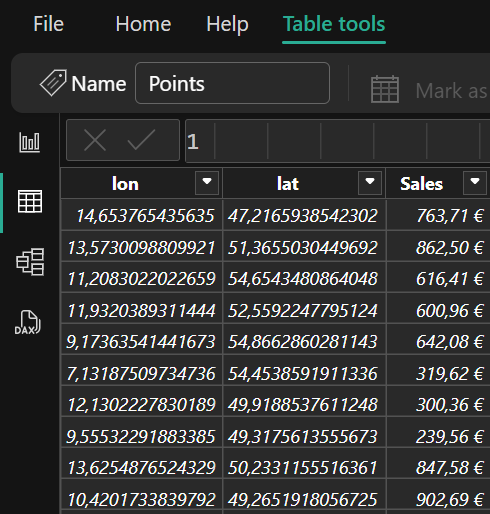
Now we want to check whether these specific points are within our polygon.
Table with the edges of a polygon
We prepare the polygon as a table of edges by joining consecutive points.
Now we want to use the new Point-in-Polygon DAX code for each of the specific points in our table Points.
Point-in-Polygon in action
This is done with a calculated column in the event table Points.
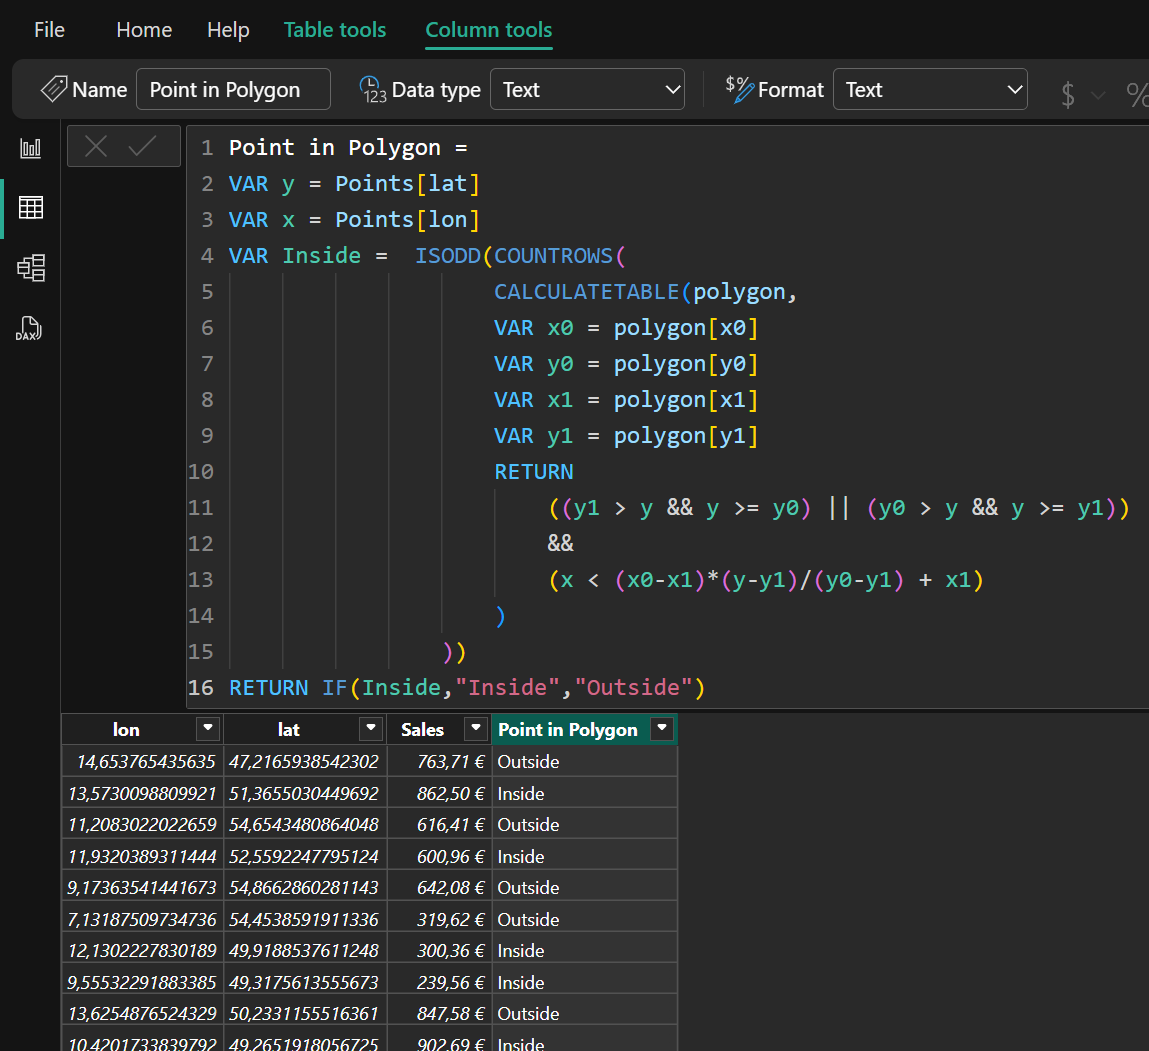
The calculated column uses our new DAX code to classify each event as “Inside” or “Outside” of our polygon.
The calculated column Point in Polygon allows improved visualizations and analysis.
Visualizing in Power BI
The image below illustrates the analytical power of Point-in-Polygon. By enriching the points with the area, the points can be grouped, sliced or highlighted.
Conclusion
Translating code from other programming languages into DAX can be a shortcut for solving problems quickly. By adapting the logic of an existing solution, we can avoid the need to deeply understand the underlying mathematical principles. However, it’s often beneficial to understand the algorithm in full, as it helps in optimizing the code and making more informed decisions.
It is very important to choose an appropriate representation of the data. Only by switching from the obvious point lists to a representation as edges we achieved the fast performing and elegant DAX solution.
If you want to dive deeper into the geometry of Point-in-Polygon or see more applications of the Point-in-Polygon DAX code take a look at Geoanalysis with Power BI.
If you like this post
I would like to hear from you if you have a use case for Point-in-Polygon in Power BI.
You can share this post or comment on LinkedIn or X.
If there is interest I may prepare posts with more details.